Build Your Own Custom Dashboards
Using the Analytics Builder, you can build your own Custom Dashboards based on your organization's unique needs. Custom dashboards are presented in your Insights workspace in the lefthand menu below the Standard Dashboards.
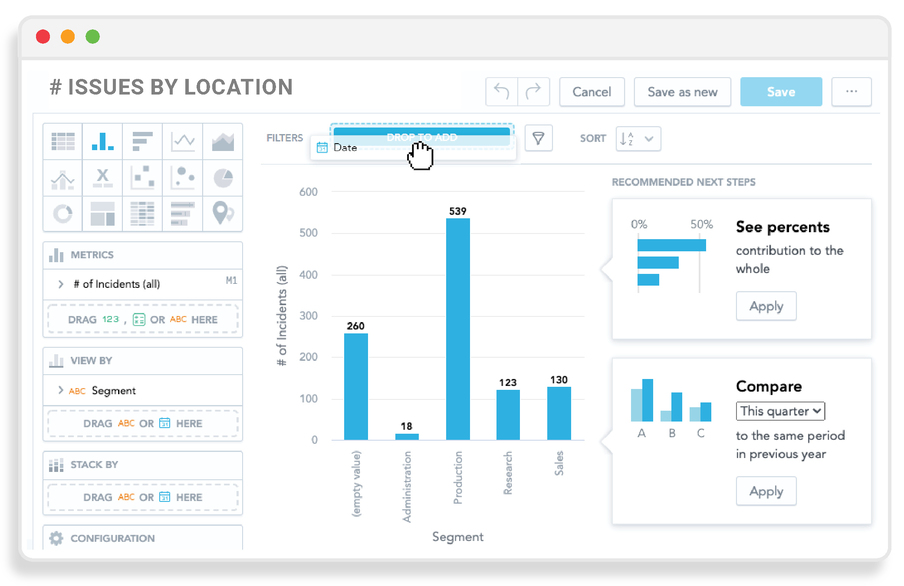
Analytical Builder is an environment for data discovery and visualization using the Dakota Insights user interface. You can drag and drop your ProActivity data to interactive zones to:
- Create insights (charts, graphs, and tables)
- Slice the data
- Filter the data
- Change the way data is visualized
Insights change dynamically with each click, enabling you to explore and interact with your data.
Analytics Builder is licensed to Insights clients on a "Per User" basis. Contact Us to learn more about creating your own Custom Dashboards.
Related Articles
Have Dakota Build Custom Dashboards For You
Dakota Software's Services team can build Custom Dashboards based on your organizations unique needs. Custom dashboards: Are unique to your Insights workspace Are presented in the lefthand menu below the Standard Dashboards Can include a combination ...Schedule Automatic Emailing of Dashboards
All users can schedule automatic emailing of dashboards and/or insights that they can access, based on any filtering parameters they have selected. Insights then regularly sends the data attached as: A PDF file for dashboards, A CSV or XLSX for ...Using Filters on Dashboards
You can filter dashboards by date, location, and other attributes. The filters that you select will apply to all visualizations on the dashboard. Filter by date The dashboards date filter enables you to filter your data by date ranges using the ...Export Dashboards and Insights
In dashboards, you can export the entire dashboard as PDF, or individual insights as XLSX or CSV files. You cannot export individual Key Performance Indicators (KPIs). Export an entire dashboard as PDF Select the dashboard that you want to export. ...Dashboard Overviews
Dashboards are visualizations that can display insights and individual key performance indicators (KPIs). Dashboards allow a wide array of adjustments such as filtering and drilling. You can, for example: Track KPI changes over time and compare it to ...